Notice in the chart above where the wind farms in Iowa are clustered. They tend to be in the North and West where the highest wind speeds are located. The simple prevailing logic for wind farms states that new farms should be built where they have high wind potential and can therefore provide more energy. However, this logic does not account for variations in demand and limitations in transmission.
Without adequate storage facilities, any energy that is generated by a wind farm must be immeadiately transmitted and consumed. The energy must therefore be sold and the current local price (learn more about how the price of energy fluctuates). As wind speed increases, the energy output from that farm will increase, but if demand remains flat, the price that energy is sold at will decrease. This is a simple supply and demand issue. Here's an example:
If the wind speed is 10mph, ABC Energy's Wind Farm produces 50MWh of energy each hour and sells all the energy to a nearby town that has a demand of 75MWh of energy each hour. The town buys the energy at $30/MWh.
50MWh x $30/MWh = $1,500Now the wind speed increases to 20mph and ABC Energy's Wind Farm produces 100MWh of energy each hour and wants to sell it all to the nearby town at $30/MWh. But the town only needs 75MWh and another wind farm two counties over called and said that because of the high winds they have excess energy to sell too and they will sell to the town for $20/MWh. Ultimately ABC Energy agrees with the town to sell them 75MWh at $15/MWh and gets no value for the remaining energy because there is no nearby demand and insufficient transmission to sell long distances.
75MWh x $15/MWh = $1,250The Wind Farm produced twice as much energy at high wind speeds, but didn't realize any additional fianicial gains
Sixteen sites in Iowa and Illinois were studied using their wind and energy price data between 2013 and 2015 to determine the average amount of wind energy produced and yearly revenue generated from each site.
| Node name | City | State | Yearly Revenue | Yearly Energy Produced | ||
|---|---|---|---|---|---|---|
| 1 | TVA.WHITEOAK | Bloomington | IL | $3.29M | 105.7GWh | |
| 2 | AMIL.HENNEPN82 | Peru | IL | $2.90M | 85.8GWh | |
| 3 | ATLW.ALTW | Marshalltown | IA | $2.73M | 95.9GWh | |
| 4 | AMIL.CLINTO51 | Decatur | IL | $2.48M | 91.3GWh | |
| 5 | CWLP.DALLMA84 | Springfield | IL | $2.47M | 82.3GWh | |
| 6 | ALTW.BRLGTN5 | Burlington | IA | $2.29M | 77.0GWh | |
| 7 | AMIL.EDWARDS2 | Peoria | IL | $2.28M | 70.2GWh | |
| 8 | AMIL.PPI | Jacksonville | IL | $2.14M | 70.9GWh | |
| 9 | MPW.UNIT_9 | Muscatine | IA | $2.03M | 73.2GWh | |
| 10 | MEC.OTTUMWA1 | Ottumwa | IA | $1.82M | 92.8GWh | |
| 11 | MEC.NEALN_2 | Sioux City | IL | $1.70M | 90.4GWh | |
| 12 | ALTW.DAEC | Independence | IA | $1.69M | 87.7GWh | |
| 13 | MEC.WSEC3 | Council Bluffs | IA | $1.65M | 97.0GWh | |
| 14 | ALTW.LANSIN4 | Decorah | IA | $1.58M | 62.9GWh | |
| 15 | MEC.PPWIND | Fort Dodge | IA | $1.14M | 74.8GWh | |
| 16 | AMIL.STWF | Kakakee | IL | $0.70M | 74.4GWh |
Comments: GREEN sites are the best areas to build wind power, they have strong wind potential and strong energy prices. BROWN sites are sites with strong energy prices, but only average wind potential. They are the next best sites for building new wind farms. BLUE sites have strong wind potential, but weak energy prices. These sites should build additional transmission to allevate wind saturation. RED sites are poor sites to build new wind farms at because they have both low wind potential and weak energy prices.
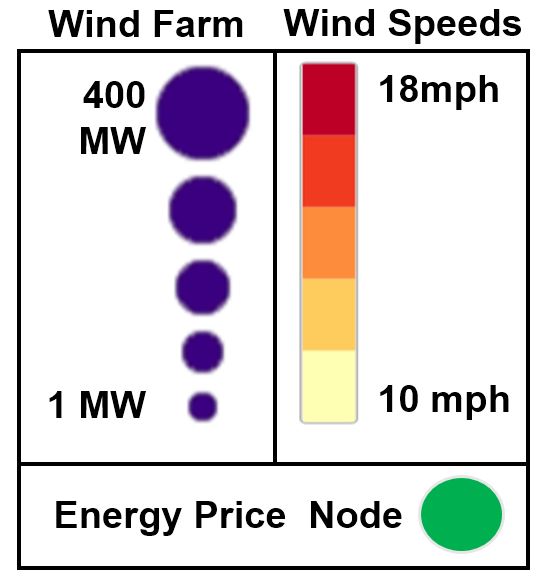
Wind farms produce more energy when wind speeds are higher. For regions where the price of energy decreases with wind speed, this phenomenon causes wind farms to produce a large percentage of their energy below a node's average energy price. By comparing the price of wind specific energy to the average price of all generation, we can get a good idea how much wind energy is pushing down local energy prices. Below is a breakdown how the value of wind generated energy compares to the average from all forms of energy.
On the left, you can see how wind prices will actually be lower than the average price of all generation. But how much are the average prices being brought down by the presence of wind in a certain location? By comparing the the overall average price to average energy price when the wind speed is zero in a location, we can see how much revenue non-wind forms of generation have lost because of an over supply of wind. The chart below shows a breakdown of how the average energy price from all forms of energy is effected over the past three years.
In the chart above the color of each node represents how valuable each MWh of wind energy produced at a site is worth. The size of the colored circle represents the amount of wind energy produced at the site and the black circle represents the amount of revenue from wind generated at the site. For red sites the black circle will be smaller than the colored circle showing that the ecocomics for the site are underutilizing the available wind resource. For green sites the black circle will be larger than colored circle showing that the economic for the site a favorable.
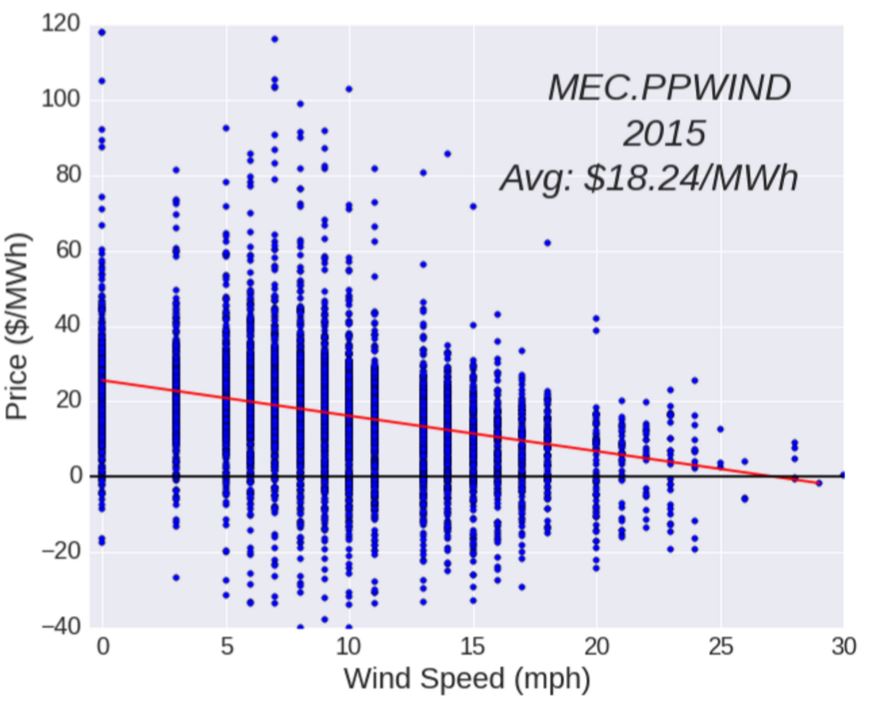
Below is an example, taken from northwestern Iowa. The data comes from the MEC.PPWIND node point (see map above), which has over 500MW of wind power within 100 miles of the node point. The first figure shows that the price of energy at this node point shows a strong negative trend for Energy Prices with respect to wind speed. As the wind speed increase the local price of energy decreases. The energy prices are a reflection of local supply and demand. When wind speeds are high wind farms produce lots of generation. Demand however, will not change. This oversupply of energy will drive down prices (in some cases the price will even go below zero, where generators in pay you to take their energy). If their was perfect transmission, this excess energy could flow to other demand around the country, but with the physical limitations of the grid, the energy can not be used efficiently.
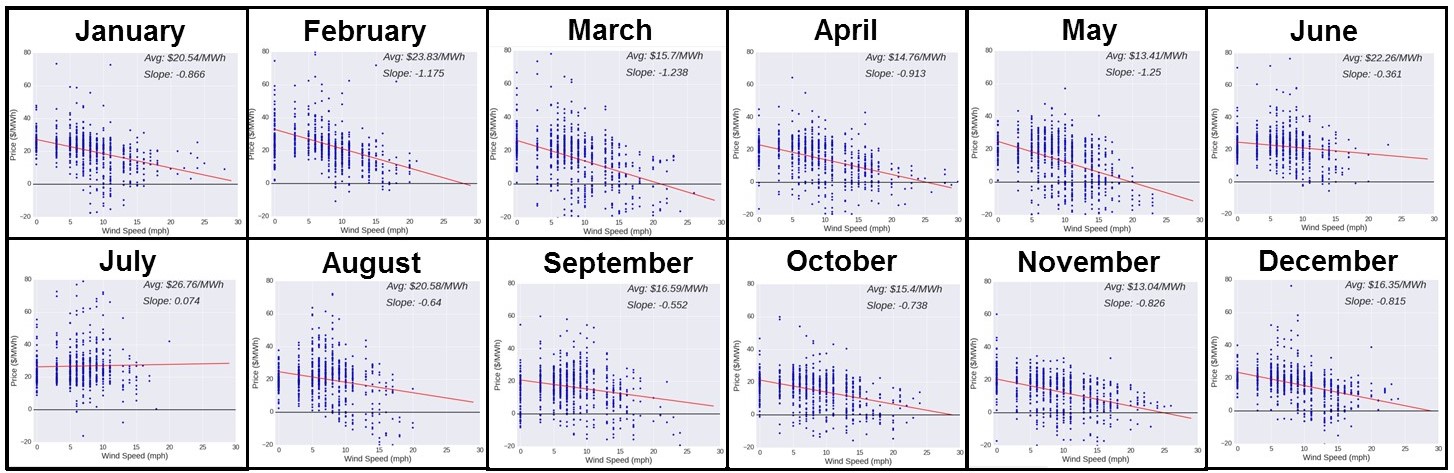
We can study this trend in the monthly breakdown of energy prices vs. wind speed. For the windiest months (in the spring) when excess generation occurs, we see the strongest downward trend. In the months with the least wind (in the summer), the trend disappears. Summer months also generally have the largest energy demand which helps to balance any additional generation from wind.
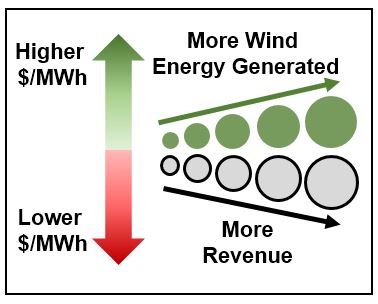
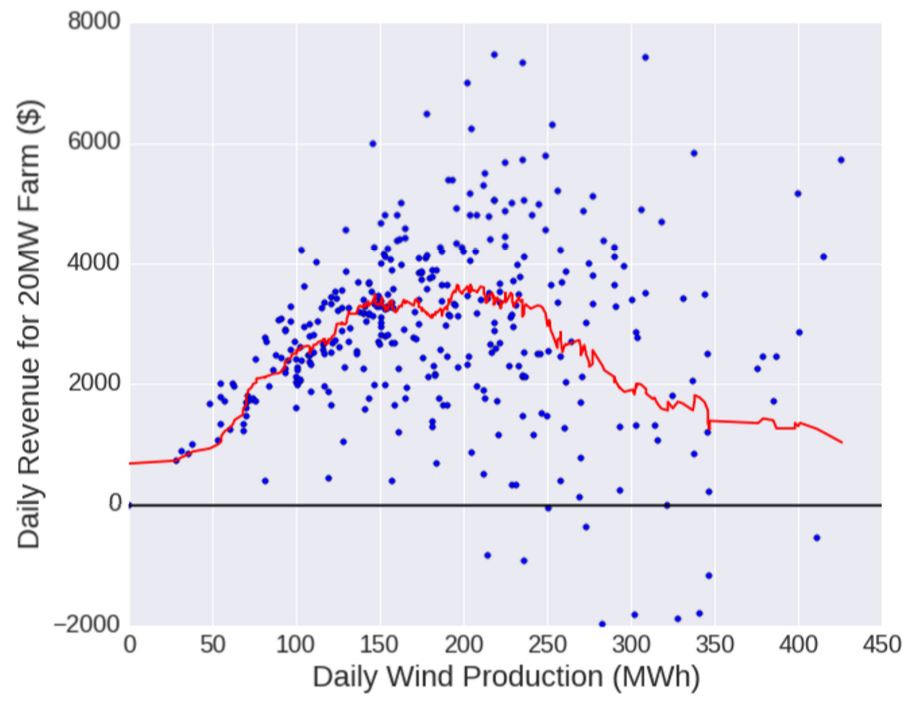
If energy prices remained constant, we would expect the revenue from wind farms to be roughly linear with respect to total amount of energy produced. That is basis for the coventional wisdom on siting wind farms: "place them in windier areas so that they generate more energy and therefore more revenue." But after the previous analysis, we know this is not always true because the price of energy may be affected by the production of wind energy. To show that this statement is flawed, we calculated the total amount of energy produced each day by a 20MW wind farm at the node site (see methodology section for more info) and the amount of daily revenue generated by the farmed based on seeling all of the generated energy at the real-time market price. The plot below shows all 365 days in 2015. The red line is a moving average of the points. The chart shows that at low amounts of power produced the amount of revenue will increase in a nearly linear fashion as expected by conventional wisdom. However, at above 150MWh of energy produced this trend no longer holds and we do not receive any additional benefit from producing more energy. If fact on the days when the most energy was produced, less revenue was generated on average because energy prices were driven so low.
Building more wind farms near the MEC.PPWIND node would not be profitable. And any contracts made with existing wind farms in this area should be careful not to overvalue energy from this region. A cursory look at area energy prices might not show how much wind power specifically is depressed in the area. The MEC.PPWIND node had an average price of $18.50/MWh for all types of energy, but wind energy only received an average of $15.96/MWh. There is one way to drastically change the value of these wind farms. Add transmission to high demand areas. The easiest way to alleviate constraints on the system is to create better transmission. Additionally, energy storage would help allievate some of the problem by allowing energy to be stored at low prices and released at higher prices.
Matthew T. Lawder
matt@stlannex.com