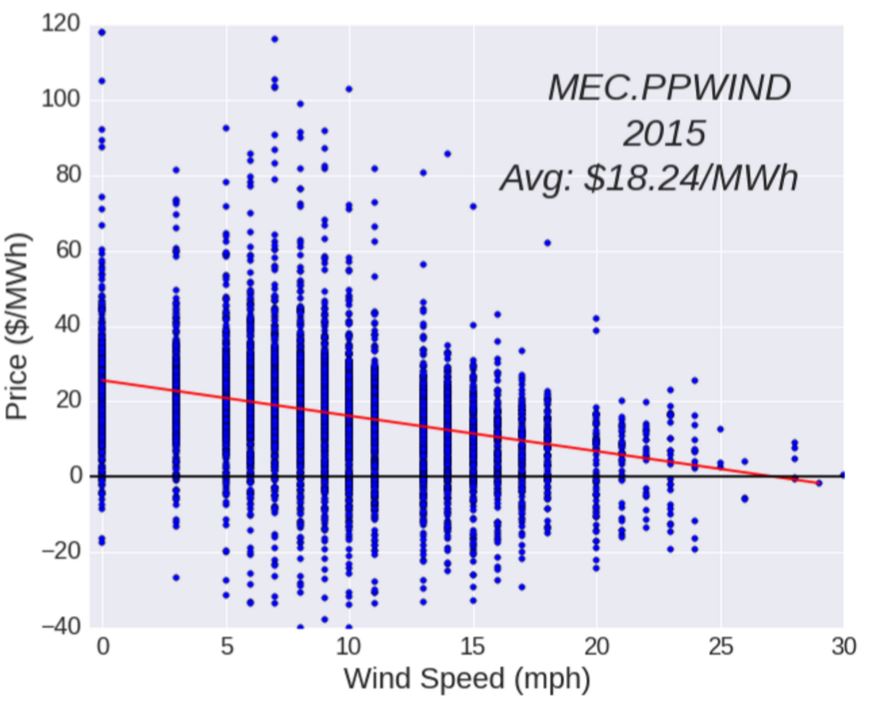
While your utility probably bills you at a flat rate for every unit (kWh) of energy you consume, the price of energy is not constant. Many different utilities and third-party operators generate energy and they buy sell energy in real-time. When local demand is for energy is high (eg. during a hot summer day), prices will be driven up in order to secure more generation. When there is lots of generation, but low demand (eg. on a blustry day near an isolated wind farm) prices will be driven down. All of these prices are monitored and regulated by the Midcontinent Independent System Operator Regional Transmission Organization or MISO for short. They monitor the price of energy across a large swath of middle America. By studying their historical database on prices from 10's of thousands of nodes, we make actionable decisions to:
The prevailing logic states that wind farms need to be built in areas with the highest wind potential. This is true when your goal is to produce the most energy from a wind turbine as possible. However, if your goal is to maximize profit, placing turbines is not that simple.
The map below shows all of the wind farms in purple for the state of Iowa on top of an annual average wind speed map. Most of the farms are clustered in the areas that recieve the highest wind. They will produce more energy, but when the wind is at high speed and all these farms are producing together, they drive down energy prices in the area. This creates diminishing returns for a wind farm.
The graph on the right the correlation between energy prices at a wind farm (the MEC.PPWIND node near Fort Dodge in the image below) and wind speeds in he area. The downward trend shows that as the wind goes up the value of energy goes does disincentivizing the wind farm to produce energy
Instead of placing new wind farms in these saturated markets, new sites that allow do not follow this trend need to be found.
Price of energy at different wind speeds for MEC.PPWIND node. Sometimes the price is even negative!
You can select from over 100 node points throughout the Midwest region to see the histroical energy prices at each node for any date range over the previous 4 years.
Select the Single Node option to look at an indivdual node points changes in energy prices. Select the Compare Two Nodes option to see the differences in prices at each node. The difference in price between nodes is considered the effective transmission costs for buying power from these sites.
MISO stands for Midcontinent Independent System Operators. It is a Regional Trnasmission Organization that maintains the energy market for a large swath of the Midwest and parts of Canada. Check out more on the Methodology Page.
I recently graduated from Washington University in St. Louis with a PhD in Energy, Environmental, and Chemical Engineering. During my tenure in grad school, I researched computational Li-ion battery modeling and conducted long-term battery aging experiments. Conducting long-term studies, created the oppurtunity to develop skills for dealing with and analyzing large data sets. I am currently a Fellow at The Data Incubator in New York City where I am continuing to develop my abilities for data science.
Outside of work, I enjoy running. In 2015, I completed both the Boston and New York City Marathons. In Boston I finished 46th overall (22nd American) in a time of 2:26:21. If you would like to know more about me or my qualifications please contact me at matt@stlannex.com.