By the Numbers: Delta at St. Louis-Lambert Airport
This post is the first in a series of posts outlining key info for each carrier at St. Louis-Lambert. I won't try to add too much word clutter to these posts. Mostly, I'll try to provide some context for the data and highlight interesting points that pop out. A couple of quick notes, all data is through the end of 2018 and accounts only for domestic flights. More info about the methodology for data calculations can be found here.
Delta is a pretty straight forward case to start with at Lambert. They have had consistent service at Lambert for the last decade. Every year since 2014, they have flown between 18k-19k flights into or out of Lambert and carried 1.7M passengers. The biggest changes for Delta were dropping their Memphis and New York-JFK routes early in the decade while continuously adding capacity to New York-LGA. Delta carried 87k passengers between STL and LGA in 2012 and increased that to 184k by 2018.
Charts and Graphs are best viewed on a desktop. If on phone, hold horizontal for best viewing.
As with many airlines, Delta farms out many of it's routes to be run by a regional airline under the Delta Connections banner. At STL, about 52% of the departures by Delta are under the Delta Connections banner, but because these are run on smaller planes they carry only 33% of total Delta passengers. When looking at the numbers below, you can toggle between All Flights, Mainline Flights Only, and Regional Flights Only to look at how Delta breaks down its service.
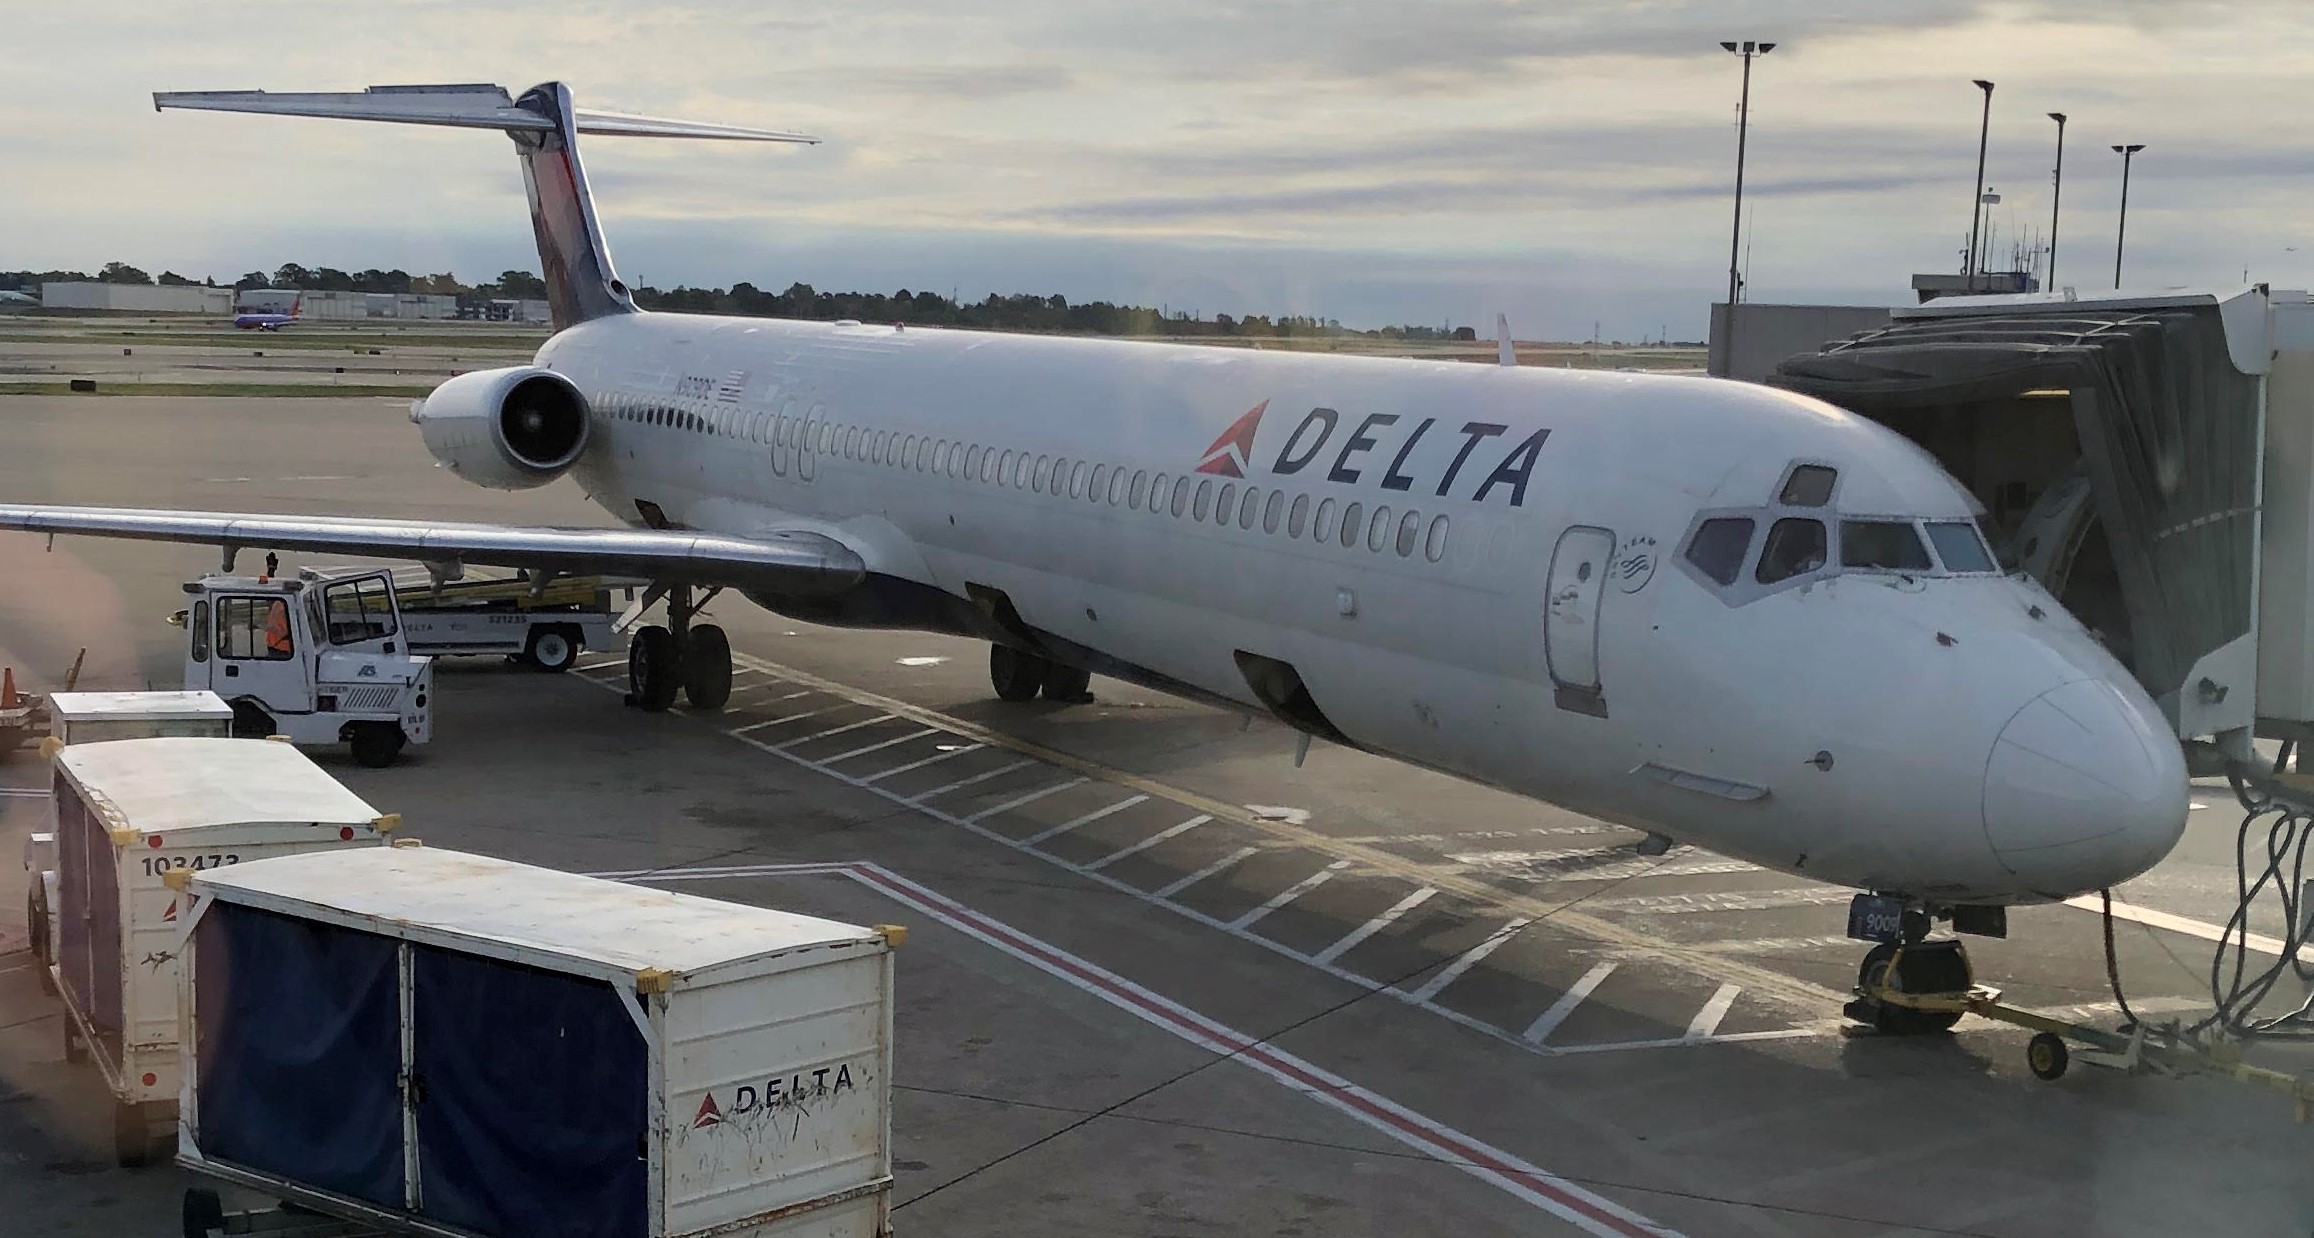
On its Mainline flights, Delta most often uses the MD-80 (seen at top of page) and MD-90 one of the final designs from St. Louis' McDonnell Douglas Corporation (which was then bought by Boeing). These planes carry over 50% of Mainline passengers and roughly 1 out of every 3 passengers flying Delta (or Delta Connections) to/from STL is carried on one of these planes. These aircraft are set to be retired in the coming years, so it will be interesting to see what they are replaced by at Lambert. On the Delta Connections side, the regional airlines rely heavily on the CRJ 900 and 700 which account for 90% of passengers flown out of Lambert by Delta.
I also looked at the Airline Origin and Destination Survey (DB1B) to see the ultimate domestic destinations for Delta passengers. For example, 369k passengers fly from St. Louis to Atlanta on Delta's direct route, but only 103k passengers that begin their trip in St. Louis actually end their trip in Atlanta. The rest are connecting to other destinations. The chart at the bottom of the page shows the top 20 Destinations for Delta Passengers to/from St. Louis. All of Delta's hubs are at the top of the list and Delta ranks as the leading carrier for passengers to ATL, LGA, MSP, DTW, SLC, and CVG. Once you get outside of the hubs, there is a lot of travel to the Southeast region of the US. After taking out the top 6 Delta hubs, 11 out of the remaining 14 destinations could be considered in the Southeast. These passengers are presumably using the enormous ATL Delta hub to get quickly to these airports. I wouldn't necessarily call Delta the dominant carrier to the Southeast though as evidenced by the fact that they still rank 2nd or 3rd in terms of passengers delivered from STL for many of these destinations, but they are clearly a well used option throughout that region.
Please explore the data more below. I'll be posting similar data for more airlines at STL soon, so check back.
Delta is a pretty straight forward case to start with at Lambert. They have had consistent service at Lambert for the last decade. Every year since 2014, they have flown between 18k-19k flights into or out of Lambert and carried 1.7M passengers. The biggest changes for Delta were dropping their Memphis and New York-JFK routes early in the decade while continuously adding capacity to New York-LGA. Delta carried 87k passengers between STL and LGA in 2012 and increased that to 184k by 2018.
Annual Delta Numbers for all routes
| 2010 | 2011 | 2012 | 2013 | 2014 | 2015 | 2016 | 2017 | 2018 | |
|---|---|---|---|---|---|---|---|---|---|
| Departures | 18,405 | 20,253 | 21,321 | 20,840 | 18,490 | 18,032 | 18,359 | 18,519 | 18,959 |
| Passengers | 1,481,717 | 1,631,146 | 1,719,201 | 1,736,929 | 1,720,468 | 1,741,502 | 1,737,865 | 1,705,211 | 1,683,820 |
As with many airlines, Delta farms out many of it's routes to be run by a regional airline under the Delta Connections banner. At STL, about 52% of the departures by Delta are under the Delta Connections banner, but because these are run on smaller planes they carry only 33% of total Delta passengers. When looking at the numbers below, you can toggle between All Flights, Mainline Flights Only, and Regional Flights Only to look at how Delta breaks down its service.
On its Mainline flights, Delta most often uses the MD-80 (seen at top of page) and MD-90 one of the final designs from St. Louis' McDonnell Douglas Corporation (which was then bought by Boeing). These planes carry over 50% of Mainline passengers and roughly 1 out of every 3 passengers flying Delta (or Delta Connections) to/from STL is carried on one of these planes. These aircraft are set to be retired in the coming years, so it will be interesting to see what they are replaced by at Lambert. On the Delta Connections side, the regional airlines rely heavily on the CRJ 900 and 700 which account for 90% of passengers flown out of Lambert by Delta.
I also looked at the Airline Origin and Destination Survey (DB1B) to see the ultimate domestic destinations for Delta passengers. For example, 369k passengers fly from St. Louis to Atlanta on Delta's direct route, but only 103k passengers that begin their trip in St. Louis actually end their trip in Atlanta. The rest are connecting to other destinations. The chart at the bottom of the page shows the top 20 Destinations for Delta Passengers to/from St. Louis. All of Delta's hubs are at the top of the list and Delta ranks as the leading carrier for passengers to ATL, LGA, MSP, DTW, SLC, and CVG. Once you get outside of the hubs, there is a lot of travel to the Southeast region of the US. After taking out the top 6 Delta hubs, 11 out of the remaining 14 destinations could be considered in the Southeast. These passengers are presumably using the enormous ATL Delta hub to get quickly to these airports. I wouldn't necessarily call Delta the dominant carrier to the Southeast though as evidenced by the fact that they still rank 2nd or 3rd in terms of passengers delivered from STL for many of these destinations, but they are clearly a well used option throughout that region.
Please explore the data more below. I'll be posting similar data for more airlines at STL soon, so check back.
Direct Route Stats (2018 All FlightsMainlineRegionals Only)
Info on any direct routes served by the airline to or from St. Louis (Lambert)| DESTINATION | CITY | PASSENGERS | LOAD FACTOR | DEPARTURES | AVG TRIP TIME | AVG TAXI TIME |
|---|---|---|---|---|---|---|
| ATL | Atlanta, GA | 370,196 | 83.9 | 2,730 | 95.4 | 20.1 |
| MSP | Minneapolis, MN | 170,394 | 74.4 | 1,897 | 90.3 | 25.7 |
| DTW | Detroit, MI | 127,677 | 84.3 | 1,812 | 94.9 | 24.1 |
| LGA | New York, NY | 93,494 | 73.9 | 1,670 | 168.5 | 37.2 |
| SLC | Salt Lake City, UT | 62,199 | 81.7 | 835 | 167.3 | 25.6 |
| CVG | Cincinnati, OH | 19,315 | 59.4 | 531 | 71.3 | 18.0 |
| MCO | Orlando, FL | 1,015 | 79.0 | 15 | 156.5 | 23.5 |
| ATL | Atlanta, GA | 369,312 | 84.1 | 2,716 | 89.6 | 20.3 |
| MSP | Minneapolis, MN | 173,151 | 75.4 | 1,900 | 91.2 | 19.7 |
| DTW | Detroit, MI | 122,420 | 80.8 | 1,811 | 88.8 | 23.0 |
| LGA | New York, NY | 90,814 | 72.5 | 1,655 | 143.8 | 27.1 |
| SLC | Salt Lake City, UT | 63,554 | 83.3 | 836 | 192.8 | 23.6 |
| CVG | Cincinnati, OH | 19,406 | 58.7 | 537 | 70.2 | 20.2 |
| MCO | Orlando, FL | 873 | 83.0 | 14 | 142.3 | 30.0 |
| ATL | Atlanta, GA | 739,508 | 84.0 | 5,446 | 92.5 | 20.2 |
| MSP | Minneapolis, MN | 343,545 | 74.9 | 3,797 | 90.7 | 22.7 |
| DTW | Detroit, MI | 250,097 | 82.6 | 3,623 | 91.9 | 23.6 |
| LGA | New York, NY | 184,308 | 73.2 | 3,325 | 156.2 | 32.2 |
| SLC | Salt Lake City, UT | 125,753 | 82.5 | 1,671 | 180.1 | 24.6 |
| CVG | Cincinnati, OH | 38,721 | 59.1 | 1,068 | 70.8 | 19.1 |
| MCO | Orlando, FL | 1,888 | 80.8 | 29 | 149.7 | 26.7 |
| DESTINATION | CITY | PASSENGERS | LOAD FACTOR | DEPARTURES | AVG TRIP TIME | AVG TAXI TIME |
|---|---|---|---|---|---|---|
| ATL | Atlanta, GA | 370,196 | 83.9 | 2,730 | 95.4 | 20.1 |
| MSP | Minneapolis, MN | 127,589 | 70.8 | 1,227 | 86.6 | 22.3 |
| DTW | Detroit, MI | 38,712 | 81.5 | 399 | 93.0 | 21.2 |
| SLC | Salt Lake City, UT | 20,512 | 71.0 | 210 | 161.9 | 23.4 |
| ATL | Atlanta, GA | 369,312 | 84.1 | 2,716 | 89.6 | 20.3 |
| MSP | Minneapolis, MN | 133,490 | 73.8 | 1,230 | 88.6 | 17.6 |
| DTW | Detroit, MI | 36,329 | 76.2 | 400 | 85.5 | 20.1 |
| SLC | Salt Lake City, UT | 22,355 | 77.0 | 211 | 188.4 | 22.3 |
| ATL | Atlanta, GA | 739,508 | 84.0 | 5,446 | 92.5 | 20.2 |
| MSP | Minneapolis, MN | 261,079 | 72.3 | 2,457 | 87.6 | 19.9 |
| DTW | Detroit, MI | 75,041 | 78.9 | 799 | 89.3 | 20.6 |
| SLC | Salt Lake City, UT | 42,867 | 74.0 | 421 | 175.2 | 22.8 |
| DESTINATION | CITY | PASSENGERS | LOAD FACTOR | DEPARTURES | AVG TRIP TIME | AVG TAXI TIME |
|---|---|---|---|---|---|---|
| LGA | New York, NY | 93,455 | 74.0 | 1,669 | 168.5 | 37.2 |
| DTW | Detroit, MI | 88,965 | 85.6 | 1,413 | 95.4 | 24.9 |
| MSP | Minneapolis, MN | 42,805 | 87.9 | 670 | 97.0 | 32.1 |
| SLC | Salt Lake City, UT | 41,687 | 88.3 | 625 | 169.2 | 26.4 |
| CVG | Cincinnati, OH | 19,315 | 59.4 | 531 | 71.3 | 18.0 |
| MCO | Orlando, FL | 898 | 85.4 | 14 | 148.9 | 23.7 |
| LGA | New York, NY | 90,814 | 72.5 | 1,655 | 143.8 | 27.1 |
| DTW | Detroit, MI | 86,091 | 83.0 | 1,411 | 89.8 | 23.9 |
| SLC | Salt Lake City, UT | 41,199 | 87.2 | 625 | 194.3 | 24.1 |
| MSP | Minneapolis, MN | 39,661 | 81.4 | 670 | 95.8 | 23.6 |
| CVG | Cincinnati, OH | 19,352 | 58.9 | 536 | 70.2 | 20.2 |
| MCO | Orlando, FL | 873 | 83.0 | 14 | 142.3 | 30.0 |
| LGA | New York, NY | 184,269 | 73.3 | 3,324 | 156.2 | 32.2 |
| DTW | Detroit, MI | 175,056 | 84.3 | 2,824 | 92.6 | 24.4 |
| SLC | Salt Lake City, UT | 82,886 | 87.8 | 1,250 | 181.8 | 25.2 |
| MSP | Minneapolis, MN | 82,466 | 84.6 | 1,340 | 96.4 | 27.9 |
| CVG | Cincinnati, OH | 38,667 | 59.2 | 1,067 | 70.8 | 19.1 |
| MCO | Orlando, FL | 1,771 | 84.2 | 28 | 145.6 | 26.9 |
Aircraft Type Stats (2018 All FlightsMainlineRegionals Only)
What type of airplanes are being used across all routes to/from St. Louis (Lambert) for the airline| Airplane | Departures | % Departures | Passengers | % Passengers | Load Factor |
|---|---|---|---|---|---|
| Canadair CRJ 900 | 6,322 | 33.3 | 382,029 | 22.6 | 79.5 |
| McDonnell Douglas DC9 Super 80/MD81/82/83/88 | 2,749 | 14.5 | 356,091 | 21.1 | 86.9 |
| McDonnell Douglas MD-90 | 2,114 | 11.1 | 247,441 | 14.7 | 74.1 |
| Boeing 737-900ER | 1,292 | 6.8 | 191,885 | 11.4 | 82.5 |
| Canadair RJ-700 | 2,552 | 13.4 | 134,156 | 8.0 | 75.4 |
| Boeing 717-200 | 1,238 | 6.5 | 111,627 | 6.6 | 82.0 |
| Boeing 757-200 | 548 | 2.9 | 84,979 | 5.0 | 78.9 |
| Airbus Industrie A320-100/200 | 581 | 3.1 | 65,163 | 3.9 | 71.2 |
| Airbus Industrie A319 | 505 | 2.7 | 47,342 | 2.8 | 71.0 |
| Embraer ERJ-175 | 478 | 2.5 | 32,031 | 1.9 | 88.8 |
| Canadair RJ-200ER /RJ-440 | 482 | 2.5 | 16,918 | 1.0 | 70.2 |
| Boeing 737-800 | 127 | 0.7 | 16,619 | 1.0 | 81.8 |
| Boeing 757-300 | 4 | 0.0 | 663 | 0.0 | 70.8 |
| Airbus Industrie A321 | 2 | 0.0 | 328 | 0.0 | 86.8 |
| Boeing 737-700/700LR/Max 7 | 2 | 0.0 | 160 | 0.0 | 64.8 |
| McDonnell Douglas DC9 Super 80/MD81/82/83/88 | 2,749 | 30.0 | 356,091 | 31.7 | 86.9 |
| McDonnell Douglas MD-90 | 2,114 | 23.1 | 247,441 | 22.0 | 74.1 |
| Boeing 737-900ER | 1,292 | 14.1 | 191,885 | 17.1 | 82.5 |
| Boeing 717-200 | 1,238 | 13.5 | 111,627 | 9.9 | 82.0 |
| Boeing 757-200 | 548 | 6.0 | 84,979 | 7.6 | 78.9 |
| Airbus Industrie A320-100/200 | 581 | 6.3 | 65,163 | 5.8 | 71.2 |
| Airbus Industrie A319 | 505 | 5.5 | 47,342 | 4.2 | 71.0 |
| Boeing 737-800 | 127 | 1.4 | 16,619 | 1.5 | 81.8 |
| Boeing 757-300 | 4 | 0.0 | 663 | 0.1 | 70.8 |
| Airbus Industrie A321 | 2 | 0.0 | 328 | 0.0 | 86.8 |
| Boeing 737-700/700LR/Max 7 | 2 | 0.0 | 160 | 0.0 | 64.8 |
| Canadair CRJ 900 | 6,322 | 64.3 | 382,029 | 67.6 | 79.5 |
| Canadair RJ-700 | 2,552 | 26.0 | 134,156 | 23.7 | 75.4 |
| Embraer ERJ-175 | 478 | 4.9 | 32,031 | 5.7 | 88.8 |
| Canadair RJ-200ER /RJ-440 | 482 | 4.9 | 16,918 | 3.0 | 70.2 |
Origin and Destination Stats (2018 All Flights)
Information on which final destination at which passengers completed (or began) their journey. For example, a passenger may fly from St. Louis to Chicago, but then continue onward to another destination. The data below looks at the final destination regardless of connections (Domestic only).| DESTINATION | CITY | PASSENGERS (OD) | OD DEST RANK AT STL | AVG FARE | PCT FREE FARES |
|---|---|---|---|---|---|
| ATL | Atlanta, GA | 106,050 | 1 | $180.63 | 6.81% |
| MSP | Minneapolis, MN | 80,070 | 1 | $234.53 | 4.60% |
| LGA | New York, NY | 79,340 | 1 | $234.58 | 6.08% |
| DTW | Detroit, MI | 54,140 | 1 | $238.52 | 5.33% |
| SLC | Salt Lake City, UT | 31,990 | 1 | $274.39 | 7.46% |
| CVG | Cincinnati, OH | 13,340 | 1 | $210.63 | 2.62% |
| MCO | Orlando, FL | 9,910 | 3 | $225.11 | 11.60% |
| JAX | Jacksonville, FL | 9,310 | 2 | $251.49 | 6.40% |
| BOS | Boston, MA | 8,290 | 3 | $285.96 | 8.08% |
| PBI | West Palm Beach/Palm Beach, FL | 8,230 | 1 | $255.23 | 6.19% |
| TPA | Tampa, FL | 8,140 | 2 | $229.82 | 9.12% |
| SAV | Savannah, GA | 7,510 | 1 | $249.89 | 5.92% |
| FLL | Fort Lauderdale, FL | 6,950 | 2 | $233.87 | 8.42% |
| RDU | Raleigh/Durham, NC | 6,920 | 3 | $268.57 | 4.37% |
| CHS | Charleston, SC | 6,780 | 2 | $242.42 | 5.94% |
| LAX | Los Angeles, CA | 6,730 | 3 | $320.45 | 12.73% |
| BHM | Birmingham, AL | 6,260 | 1 | $254.28 | 4.68% |
| PDX | Portland, OR | 6,040 | 3 | $265.97 | 5.78% |
| SEA | Seattle, WA | 5,490 | 4 | $322.07 | 6.81% |
| RSW | Fort Myers, FL | 5,440 | 2 | $239.18 | 10.12% |
| RIC | Richmond, VA | 5,140 | 2 | $275.53 | 7.53% |
| ATL | Atlanta, GA | 103,470 | 1 | $182.07 | 6.79% |
| LGA | New York, NY | 79,580 | 1 | $238.02 | 6.12% |
| MSP | Minneapolis, MN | 77,220 | 1 | $239.23 | 4.62% |
| DTW | Detroit, MI | 52,710 | 1 | $235.93 | 5.23% |
| SLC | Salt Lake City, UT | 32,560 | 1 | $270.66 | 7.64% |
| CVG | Cincinnati, OH | 12,380 | 1 | $213.42 | 2.57% |
| JAX | Jacksonville, FL | 9,280 | 2 | $256.44 | 5.94% |
| MCO | Orlando, FL | 8,980 | 3 | $230.31 | 11.83% |
| BOS | Boston, MA | 8,560 | 3 | $294.90 | 7.40% |
| PBI | West Palm Beach/Palm Beach, FL | 8,270 | 1 | $263.40 | 6.44% |
| SAV | Savannah, GA | 7,700 | 1 | $253.31 | 5.91% |
| TPA | Tampa, FL | 7,290 | 2 | $242.85 | 9.13% |
| CHS | Charleston, SC | 7,100 | 2 | $242.54 | 5.97% |
| RDU | Raleigh/Durham, NC | 6,610 | 3 | $281.71 | 4.26% |
| FLL | Fort Lauderdale, FL | 6,470 | 2 | $241.04 | 8.19% |
| LAX | Los Angeles, CA | 6,280 | 3 | $315.85 | 13.56% |
| PDX | Portland, OR | 6,060 | 3 | $270.02 | 6.50% |
| BHM | Birmingham, AL | 6,040 | 1 | $256.93 | 3.60% |
| SEA | Seattle, WA | 5,510 | 4 | $324.60 | 7.62% |
| RIC | Richmond, VA | 5,190 | 2 | $278.68 | 7.01% |
| RSW | Fort Myers, FL | 4,940 | 2 | $244.97 | 11.51% |
| ATL | Atlanta, GA | 209,520 | 1 | $181.34 | 6.80% |
| LGA | New York, NY | 158,920 | 1 | $236.30 | 6.10% |
| MSP | Minneapolis, MN | 157,290 | 1 | $236.84 | 4.61% |
| DTW | Detroit, MI | 106,850 | 1 | $237.24 | 5.28% |
| SLC | Salt Lake City, UT | 64,550 | 1 | $272.51 | 7.55% |
| CVG | Cincinnati, OH | 25,720 | 1 | $211.97 | 2.59% |
| MCO | Orlando, FL | 18,890 | 3 | $227.58 | 11.71% |
| JAX | Jacksonville, FL | 18,590 | 2 | $253.97 | 6.17% |
| BOS | Boston, MA | 16,850 | 3 | $290.51 | 7.74% |
| PBI | West Palm Beach/Palm Beach, FL | 16,500 | 1 | $259.32 | 6.31% |
| TPA | Tampa, FL | 15,430 | 2 | $235.97 | 9.12% |
| SAV | Savannah, GA | 15,210 | 1 | $251.62 | 5.92% |
| CHS | Charleston, SC | 13,880 | 2 | $242.48 | 5.95% |
| RDU | Raleigh/Durham, NC | 13,530 | 3 | $274.99 | 4.32% |
| FLL | Fort Lauderdale, FL | 13,420 | 2 | $237.33 | 8.31% |
| LAX | Los Angeles, CA | 13,010 | 3 | $318.24 | 13.13% |
| BHM | Birmingham, AL | 12,300 | 1 | $255.59 | 4.15% |
| PDX | Portland, OR | 12,100 | 3 | $267.99 | 6.14% |
| SEA | Seattle, WA | 11,000 | 4 | $323.33 | 7.21% |
| RSW | Fort Myers, FL | 10,380 | 2 | $241.91 | 10.78% |
| RIC | Richmond, VA | 10,330 | 2 | $277.11 | 7.27% |