By the Numbers: United at St. Louis-Lambert Airport
While St. Louis has experienced passenger growth for the last several years, United has not been helping, with a steady (if small) reduction in overall domestic travelers for the past three years. They are consistent though, with pretty much 1M passengers each year. The only bump in passengers or routes for United this decade was when they added Continental's Newark, Houston, and Cleveland flights (and then dropped Cleveland). United appears to grant only enough service to keep St. Louis as a destination from its hubs and not much more. And they definitely win the prize at St. Louis for least Mainline flights with regional brand United Express being used for 94% of departures (and carrying 87% of the company's passengers) in 2018. They have added a handful of Mainline flights to Denver and Houston recently, but we will see if they continue to add anymore.
Charts and Graphs are best viewed on a desktop. If on phone, hold horizontal for best viewing.
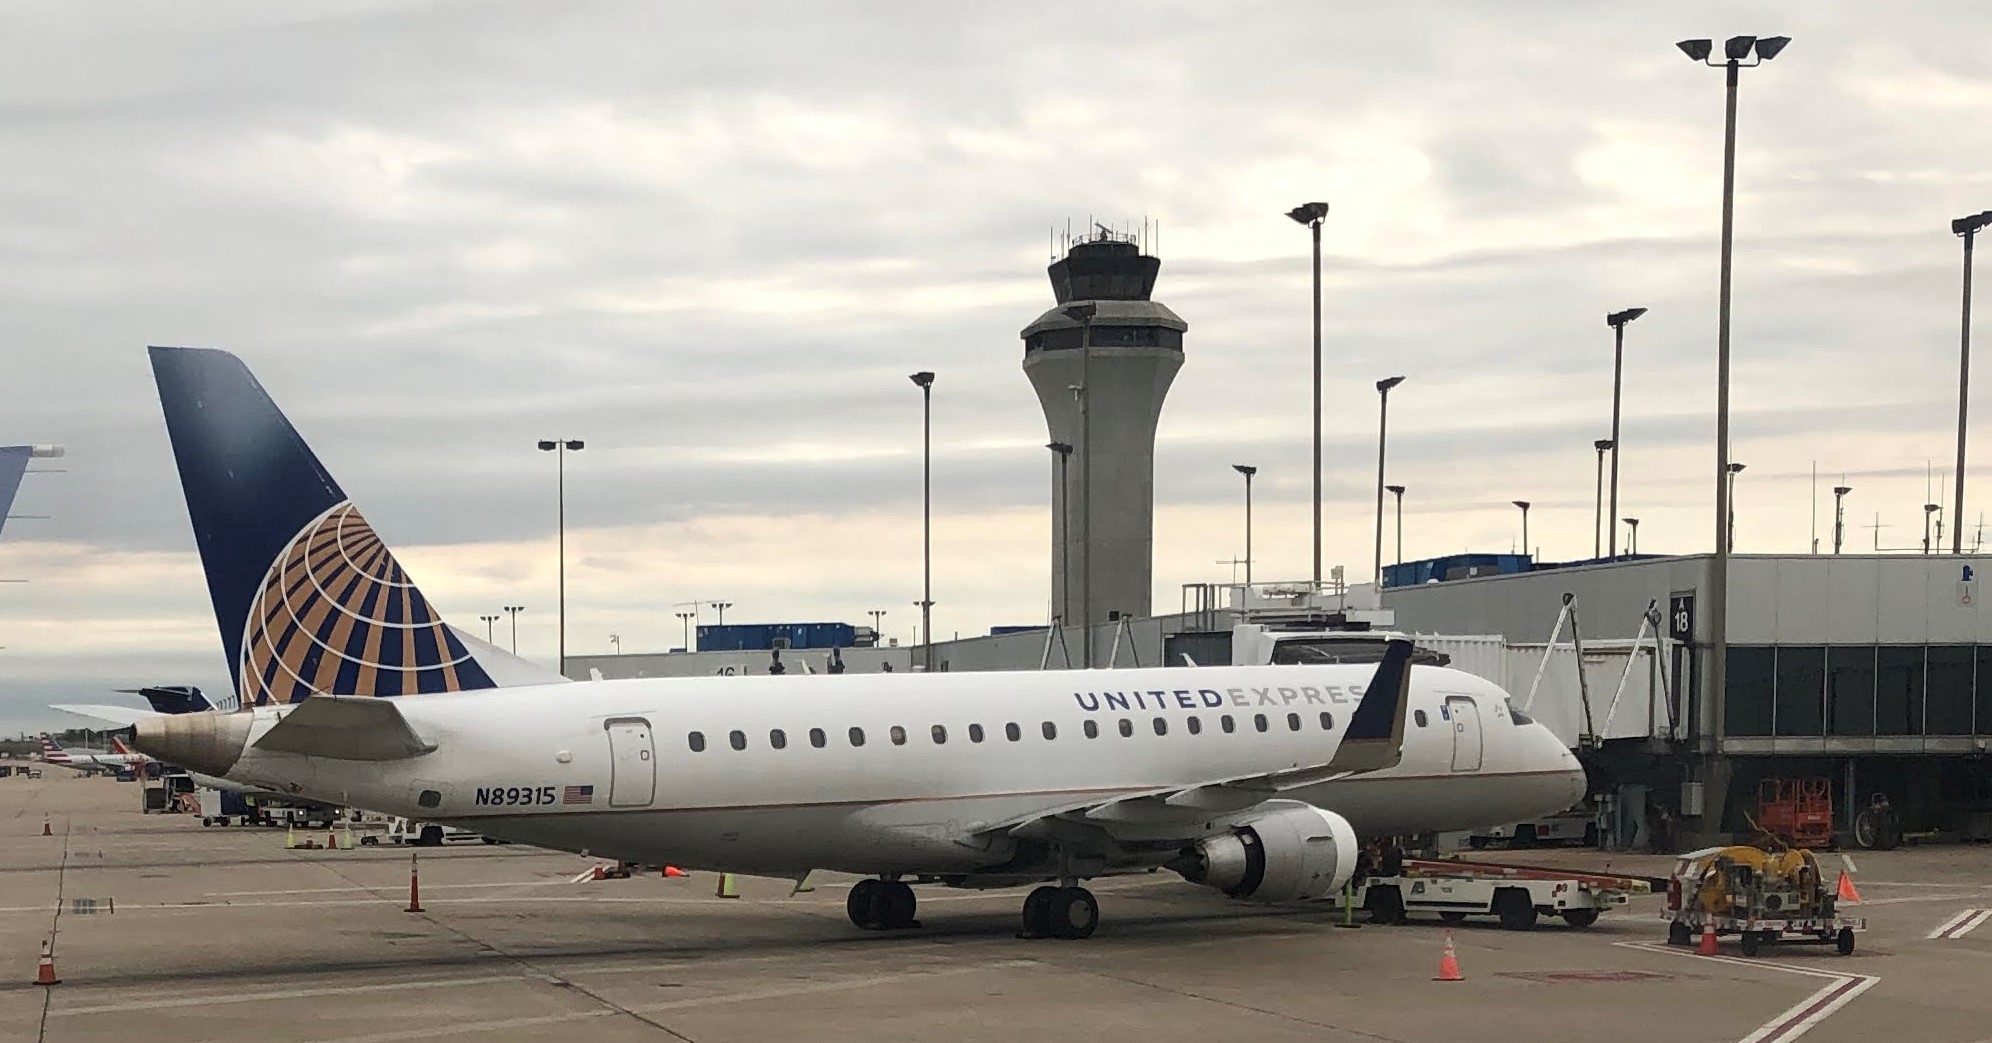
Consistency will be a theme in this post, along with their consistent overall passenger numbers, United's Load Factors for their 6 direct routes are all clustered between 81.7% and 88.0%. There doesn't seem to be any under-performers in the bunch. United serves most of these routes with multiple daily flights mostly on smaller aircraft. The Embraer-145 which only seats 50 passengers is the most common plane used by United at St. Louis accounting for 50% of all departures and 40% of all passengers. While these smaller jets allow for a decent amount of frequency on their routes, that comes at the expense of comfort during the travel. One of the reasons that United flies so many of the 50 seat regional jets is that United's contract with the Air Line Pilots Association limits the amount of flights on regional aircraft that hold more passengers. Because of this United is investing in some new more spacious 50-seat planes, but it's unlikely any of those will be coming to St. Louis. EDIT: I was wrong on this one! United will be flying on both ORD-STL (starting Oct. 2019) and IAD-STL (starting March 2019).
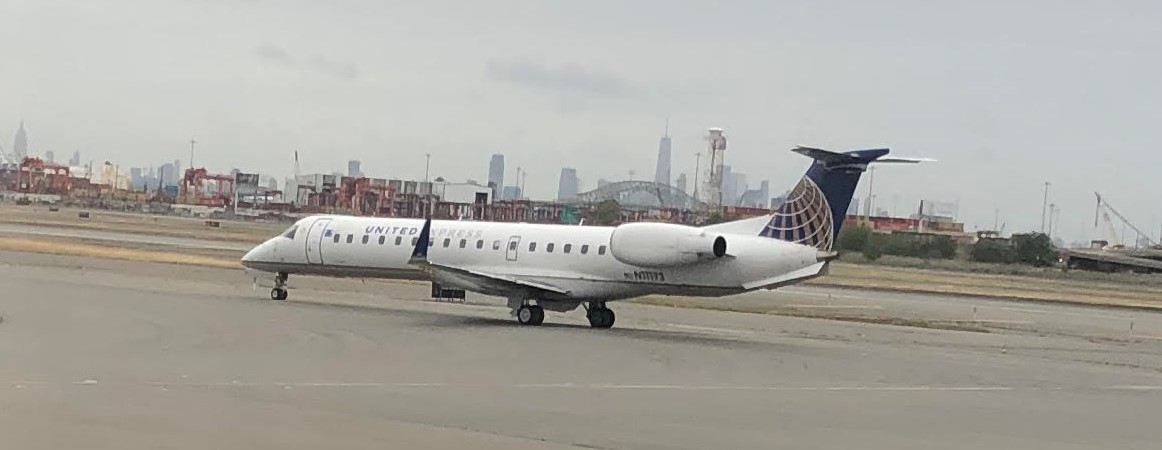
The 50 seat E145 (seen here at Newark) is very common sight at STL
The O&D numbers for United at St. Louis show that they are only the top carrier to IAH in Houston and IAD in the DC area and even at their other hubs rank only second or third which follows the narrative that they just aren't flying nearly as many passengers as the other legacy carriers. Based on the O&D and direct route numbers, United appears mostly focused on using St. Louis to funnel passengers to its hubs (as many carriers are). Washington (IAD) is a great example, where only 10% of the passengers on United direct flight between STL and IAD are using IAD as there final Destination with most people connecting on to other destinations. In this case, both Southwest and American serve the DC area (at Reagan National [DCA]) and United appears fine ceding the direct passengers to the Nation's capital to those carriers and uses their flights to DC mainly to fill connecting passengers moving elsewhere.
One route where this many change in the next year is the STL-EWR (Newark) route. Southwest is ending their direct service to Newark next month. Southwest flew 174k passengers on that direct route in 2018 and was the number one O&D carrier to Newark from St. Louis. United stands to gain some passengers from Southwest leaving even without adding more capacity of their own, but hopefully they will add some capacity to that route.
Take a look more at the numbers below (you can also see some of the methodology for these posts here) and you can see posts on other carriers at STL at the bottom of the page. Overall, United's numbers are steady even if they are smaller than comparable carriers. There doesn't appear to be anything changing about that soon.
Annual United Numbers for all routes
| 2010 | 2011 | 2012 | 2013 | 2014 | 2015 | 2016 | 2017 | 2018 | |
|---|---|---|---|---|---|---|---|---|---|
| Departures | 14,221 | 15,148 | 23,234 | 22,940 | 21,658 | 21,435 | 19,667 | 19,488 | 19,125 |
| Passengers | 719,049 | 780,235 | 1,142,308 | 1,118,770 | 1,069,872 | 1,099,731 | 1,069,796 | 1,039,892 | 1,032,484 |
Consistency will be a theme in this post, along with their consistent overall passenger numbers, United's Load Factors for their 6 direct routes are all clustered between 81.7% and 88.0%. There doesn't seem to be any under-performers in the bunch. United serves most of these routes with multiple daily flights mostly on smaller aircraft. The Embraer-145 which only seats 50 passengers is the most common plane used by United at St. Louis accounting for 50% of all departures and 40% of all passengers. While these smaller jets allow for a decent amount of frequency on their routes, that comes at the expense of comfort during the travel. One of the reasons that United flies so many of the 50 seat regional jets is that United's contract with the Air Line Pilots Association limits the amount of flights on regional aircraft that hold more passengers. Because of this United is investing in some new more spacious 50-seat planes, but it's unlikely any of those will be coming to St. Louis. EDIT: I was wrong on this one! United will be flying on both ORD-STL (starting Oct. 2019) and IAD-STL (starting March 2019).
The 50 seat E145 (seen here at Newark) is very common sight at STL
The O&D numbers for United at St. Louis show that they are only the top carrier to IAH in Houston and IAD in the DC area and even at their other hubs rank only second or third which follows the narrative that they just aren't flying nearly as many passengers as the other legacy carriers. Based on the O&D and direct route numbers, United appears mostly focused on using St. Louis to funnel passengers to its hubs (as many carriers are). Washington (IAD) is a great example, where only 10% of the passengers on United direct flight between STL and IAD are using IAD as there final Destination with most people connecting on to other destinations. In this case, both Southwest and American serve the DC area (at Reagan National [DCA]) and United appears fine ceding the direct passengers to the Nation's capital to those carriers and uses their flights to DC mainly to fill connecting passengers moving elsewhere.
One route where this many change in the next year is the STL-EWR (Newark) route. Southwest is ending their direct service to Newark next month. Southwest flew 174k passengers on that direct route in 2018 and was the number one O&D carrier to Newark from St. Louis. United stands to gain some passengers from Southwest leaving even without adding more capacity of their own, but hopefully they will add some capacity to that route.
Take a look more at the numbers below (you can also see some of the methodology for these posts here) and you can see posts on other carriers at STL at the bottom of the page. Overall, United's numbers are steady even if they are smaller than comparable carriers. There doesn't appear to be anything changing about that soon.
Direct Route Stats (2018 All FlightsMainlineRegionals Only)
Info on any direct routes served by the airline to or from St. Louis (Lambert)| DESTINATION | CITY | PASSENGERS | LOAD FACTOR | DEPARTURES | AVG TRIP TIME | AVG TAXI TIME |
|---|---|---|---|---|---|---|
| ORD | Chicago, IL | 147,885 | 84.4 | 2,787 | 77.3 | 29.9 |
| IAH | Houston, TX | 101,983 | 82.8 | 1,750 | 122.3 | 26.8 |
| DEN | Denver, CO | 97,619 | 88.2 | 1,689 | 122.1 | 24.8 |
| EWR | Newark, NJ | 72,028 | 84.1 | 1,630 | 167.4 | 32.5 |
| SFO | San Francisco, CA | 48,160 | 82.0 | 636 | 239.9 | 35.0 |
| IAD | Washington, DC | 46,886 | 84.2 | 1,068 | 138.2 | 28.7 |
| ORD | Chicago, IL | 148,515 | 84.2 | 2,804 | 81.7 | 31.0 |
| IAH | Houston, TX | 103,992 | 83.2 | 1,743 | 132.7 | 25.5 |
| DEN | Denver, CO | 99,232 | 87.9 | 1,700 | 145.1 | 25.2 |
| EWR | Newark, NJ | 72,646 | 85.3 | 1,640 | 151.3 | 30.8 |
| IAD | Washington, DC | 46,890 | 87.4 | 1,054 | 121.7 | 24.4 |
| SFO | San Francisco, CA | 46,648 | 81.3 | 624 | 272.1 | 27.3 |
| ORD | Chicago, IL | 296,400 | 84.3 | 5,591 | 79.5 | 30.4 |
| IAH | Houston, TX | 205,975 | 83.0 | 3,493 | 127.5 | 26.1 |
| DEN | Denver, CO | 196,851 | 88.0 | 3,389 | 133.6 | 25.0 |
| EWR | Newark, NJ | 144,674 | 84.7 | 3,270 | 159.4 | 31.6 |
| SFO | San Francisco, CA | 94,808 | 81.7 | 1,260 | 255.8 | 31.2 |
| IAD | Washington, DC | 93,776 | 85.8 | 2,122 | 130.0 | 26.6 |
| DESTINATION | CITY | PASSENGERS | LOAD FACTOR | DEPARTURES | AVG TRIP TIME | AVG TAXI TIME |
|---|---|---|---|---|---|---|
| DEN | Denver, CO | 23,188 | 85.5 | 175 | 115.5 | 20.1 |
| IAH | Houston, TX | 16,417 | 71.9 | 162 | 113.8 | 22.1 |
| SFO | San Francisco, CA | 15,634 | 74.3 | 140 | 227.5 | 27.3 |
| ORD | Chicago, IL | 9,724 | 65.6 | 110 | 75.7 | 29.6 |
| DEN | Denver, CO | 22,355 | 84.9 | 170 | 137.9 | 24.2 |
| IAH | Houston, TX | 15,304 | 67.5 | 161 | 123.8 | 22.2 |
| SFO | San Francisco, CA | 14,368 | 70.9 | 136 | 250.1 | 23.6 |
| ORD | Chicago, IL | 13,970 | 77.5 | 129 | 80.7 | 32.0 |
| DEN | Denver, CO | 45,543 | 85.2 | 345 | 126.6 | 22.2 |
| IAH | Houston, TX | 31,721 | 69.7 | 323 | 118.8 | 22.1 |
| SFO | San Francisco, CA | 30,002 | 72.7 | 276 | 238.6 | 25.5 |
| ORD | Chicago, IL | 23,694 | 72.2 | 239 | 78.4 | 30.9 |
| DESTINATION | CITY | PASSENGERS | LOAD FACTOR | DEPARTURES | AVG TRIP TIME | AVG TAXI TIME |
|---|---|---|---|---|---|---|
| ORD | Chicago, IL | 138,161 | 86.1 | 2,677 | 77.3 | 29.9 |
| IAH | Houston, TX | 85,566 | 85.3 | 1,588 | 123.2 | 27.3 |
| DEN | Denver, CO | 74,431 | 89.1 | 1,514 | 122.8 | 25.3 |
| EWR | Newark, NJ | 71,948 | 84.2 | 1,629 | 167.4 | 32.5 |
| IAD | Washington, DC | 46,768 | 84.3 | 1,067 | 138.2 | 28.7 |
| SFO | San Francisco, CA | 32,526 | 86.3 | 496 | 243.3 | 37.2 |
| ORD | Chicago, IL | 134,545 | 85.0 | 2,675 | 81.7 | 30.9 |
| IAH | Houston, TX | 88,688 | 86.6 | 1,582 | 133.6 | 25.8 |
| DEN | Denver, CO | 76,877 | 88.7 | 1,530 | 145.9 | 25.3 |
| EWR | Newark, NJ | 72,432 | 85.4 | 1,638 | 151.4 | 30.8 |
| IAD | Washington, DC | 46,725 | 87.4 | 1,053 | 121.7 | 24.5 |
| SFO | San Francisco, CA | 32,280 | 87.0 | 488 | 278.2 | 28.3 |
| ORD | Chicago, IL | 272,706 | 85.6 | 5,352 | 79.5 | 30.4 |
| IAH | Houston, TX | 174,254 | 86.0 | 3,170 | 128.4 | 26.5 |
| DEN | Denver, CO | 151,308 | 88.9 | 3,044 | 134.4 | 25.3 |
| EWR | Newark, NJ | 144,380 | 84.8 | 3,267 | 159.4 | 31.6 |
| IAD | Washington, DC | 93,493 | 85.8 | 2,120 | 130.0 | 26.6 |
| SFO | San Francisco, CA | 64,806 | 86.7 | 984 | 260.6 | 32.8 |
Aircraft Type Stats (2018 All FlightsMainlineRegionals Only)
What type of airplanes are being used across all routes to/from St. Louis (Lambert) for the airline| Airplane | Departures | % Departures | Passengers | % Passengers | Load Factor |
|---|---|---|---|---|---|
| Embraer-145 | 9,637 | 50.3 | 417,470 | 40.3 | 86.6 |
| Embraer ERJ-175 | 3,104 | 16.2 | 201,460 | 19.4 | 85.4 |
| Canadair RJ-700 | 3,238 | 16.9 | 192,211 | 18.5 | 84.8 |
| Canadair RJ-200ER /RJ-440 | 1,804 | 9.4 | 81,243 | 7.8 | 90.0 |
| Airbus Industrie A319 | 394 | 2.1 | 42,022 | 4.1 | 83.3 |
| Airbus Industrie A320-100/200 | 333 | 1.7 | 38,225 | 3.7 | 76.5 |
| Boeing 737-900 | 175 | 0.9 | 21,015 | 2.0 | 67.1 |
| Boeing 737-800 | 173 | 0.9 | 19,787 | 1.9 | 68.9 |
| Boeing 737-700/700LR/Max 7 | 142 | 0.7 | 12,711 | 1.2 | 71.0 |
| Emb-170 | 153 | 0.8 | 8,563 | 0.8 | 79.5 |
| Boeing 757-300 | 8 | 0.0 | 1,396 | 0.1 | 80.0 |
| Boeing 757-200 | 2 | 0.0 | 322 | 0.0 | 95.3 |
| Airbus Industrie A319 | 394 | 32.1 | 42,022 | 31.0 | 83.3 |
| Airbus Industrie A320-100/200 | 333 | 27.1 | 38,225 | 28.2 | 76.5 |
| Boeing 737-900 | 175 | 14.3 | 21,015 | 15.5 | 67.1 |
| Boeing 737-800 | 173 | 14.1 | 19,787 | 14.6 | 68.9 |
| Boeing 737-700/700LR/Max 7 | 142 | 11.6 | 12,711 | 9.4 | 71.0 |
| Boeing 757-300 | 8 | 0.7 | 1,396 | 1.0 | 80.0 |
| Boeing 757-200 | 2 | 0.2 | 322 | 0.2 | 95.3 |
| Embraer-145 | 9,637 | 53.7 | 417,470 | 46.3 | 86.6 |
| Embraer ERJ-175 | 3,104 | 17.3 | 201,460 | 22.4 | 85.4 |
| Canadair RJ-700 | 3,238 | 18.1 | 192,211 | 21.3 | 84.8 |
| Canadair RJ-200ER /RJ-440 | 1,804 | 10.1 | 81,243 | 9.0 | 90.0 |
| Emb-170 | 153 | 0.9 | 8,563 | 1.0 | 79.5 |
Origin and Destination Stats (2018 All Flights)
Information on which final destination at which passengers completed (or began) their journey. For example, a passenger may fly from St. Louis to Chicago, but then continue onward to another destination. The data below looks at the final destination regardless of connections (Domestic only).| DESTINATION | CITY | PASSENGERS (OD) | OD DEST RANK AT STL | AVG FARE | PCT FREE FARES |
|---|---|---|---|---|---|
| IAH | Houston, TX | 45,010 | 1 | $256.49 | 10.45% |
| EWR | Newark, NJ | 41,110 | 2 | $275.06 | 6.23% |
| ORD | Chicago, IL | 39,080 | 2 | $225.25 | 4.13% |
| SFO | San Francisco, CA | 37,760 | 2 | $310.28 | 8.69% |
| DEN | Denver, CO | 29,910 | 3 | $203.63 | 6.21% |
| IAD | Washington, DC | 10,420 | 1 | $248.94 | 7.42% |
| HNL | Honolulu, HI | 5,390 | 2 | $480.58 | 5.27% |
| LAX | Los Angeles, CA | 4,470 | 4 | $314.20 | 13.45% |
| BOS | Boston, MA | 4,310 | 4 | $266.05 | 10.23% |
| PDX | Portland, OR | 3,960 | 4 | $239.43 | 4.49% |
| SEA | Seattle, WA | 3,680 | 5 | $297.82 | 10.18% |
| SNA | Santa Ana, CA | 3,590 | 3 | $283.67 | 6.21% |
| LAS | Las Vegas, NV | 3,530 | 5 | $241.28 | 5.69% |
| AUS | Austin, TX | 3,020 | 3 | $211.77 | 6.34% |
| SAN | San Diego, CA | 2,860 | 5 | $252.15 | 7.12% |
| SAT | San Antonio, TX | 2,860 | 3 | $227.07 | 4.76% |
| SMF | Sacramento, CA | 2,810 | 4 | $269.32 | 6.84% |
| CLE | Cleveland, OH | 2,320 | 3 | $270.31 | 5.94% |
| COS | Colorado Springs, CO | 2,140 | 2 | $261.76 | 5.42% |
| SLC | Salt Lake City, UT | 2,030 | 5 | $253.00 | 7.41% |
| MSY | New Orleans, LA | 1,950 | 4 | $241.67 | 10.17% |
| IAH | Houston, TX | 45,070 | 1 | $260.42 | 10.28% |
| EWR | Newark, NJ | 40,010 | 2 | $273.49 | 6.41% |
| ORD | Chicago, IL | 39,290 | 2 | $231.13 | 3.67% |
| SFO | San Francisco, CA | 37,800 | 2 | $310.86 | 8.06% |
| DEN | Denver, CO | 31,980 | 3 | $203.30 | 4.92% |
| IAD | Washington, DC | 9,750 | 1 | $244.24 | 6.44% |
| HNL | Honolulu, HI | 5,930 | 2 | $461.25 | 4.22% |
| LAX | Los Angeles, CA | 4,360 | 4 | $306.25 | 14.44% |
| PDX | Portland, OR | 4,330 | 4 | $225.11 | 3.34% |
| BOS | Boston, MA | 3,930 | 4 | $268.25 | 10.08% |
| SNA | Santa Ana, CA | 3,780 | 3 | $294.54 | 7.39% |
| SEA | Seattle, WA | 3,580 | 5 | $310.08 | 7.19% |
| AUS | Austin, TX | 3,080 | 3 | $218.40 | 6.21% |
| SAN | San Diego, CA | 3,030 | 5 | $248.29 | 6.69% |
| SMF | Sacramento, CA | 2,910 | 4 | $272.39 | 5.43% |
| SAT | San Antonio, TX | 2,780 | 3 | $231.08 | 5.30% |
| LAS | Las Vegas, NV | 2,520 | 5 | $212.49 | 6.33% |
| CLE | Cleveland, OH | 2,450 | 3 | $291.86 | 6.52% |
| COS | Colorado Springs, CO | 1,940 | 2 | $271.55 | 5.43% |
| MSY | New Orleans, LA | 1,790 | 4 | $216.42 | 6.55% |
| PHX | Phoenix, AZ | 1,780 | 4 | $219.86 | 12.66% |
| IAH | Houston, TX | 90,080 | 1 | $258.46 | 10.37% |
| EWR | Newark, NJ | 81,120 | 2 | $274.29 | 6.32% |
| ORD | Chicago, IL | 78,370 | 2 | $228.21 | 3.90% |
| SFO | San Francisco, CA | 75,560 | 2 | $310.57 | 8.38% |
| DEN | Denver, CO | 61,890 | 3 | $203.46 | 5.54% |
| IAD | Washington, DC | 20,170 | 1 | $246.65 | 6.95% |
| HNL | Honolulu, HI | 11,320 | 2 | $470.40 | 4.72% |
| LAX | Los Angeles, CA | 8,830 | 4 | $310.29 | 13.94% |
| PDX | Portland, OR | 8,290 | 4 | $231.91 | 3.88% |
| BOS | Boston, MA | 8,240 | 4 | $267.10 | 10.16% |
| SNA | Santa Ana, CA | 7,370 | 3 | $289.21 | 6.81% |
| SEA | Seattle, WA | 7,260 | 5 | $303.95 | 8.68% |
| AUS | Austin, TX | 6,100 | 3 | $215.12 | 6.27% |
| LAS | Las Vegas, NV | 6,050 | 5 | $229.33 | 5.95% |
| SAN | San Diego, CA | 5,890 | 5 | $250.16 | 6.90% |
| SMF | Sacramento, CA | 5,720 | 4 | $270.89 | 6.12% |
| SAT | San Antonio, TX | 5,640 | 3 | $229.04 | 5.03% |
| CLE | Cleveland, OH | 4,770 | 3 | $281.35 | 6.24% |
| COS | Colorado Springs, CO | 4,080 | 2 | $266.42 | 5.43% |
| MSY | New Orleans, LA | 3,740 | 4 | $229.37 | 8.41% |
| SLC | Salt Lake City, UT | 3,710 | 5 | $248.78 | 7.23% |