Where do Lambert's Fliers Land?
A granular look at STL's historical O&D numbers
St. Louis has had slow annual growth in the total Origin & Destination (O&D) passengers that it has generated in the last 25 year. Last month I looked at its growth compared to other airports and saw that STL has steadily declined in airport rankings for total O&D passengers. However when looking at individual routes flying to/from Lambert, you'll see a lot of change in the airport's O&D even though the combined numbers have stayed relatively consistent. The charts and tables below will offer several different angles to view these changes in O&D for STL in the past 20-25 years with each one offering a variation on the overall view. I'll point out some interesting takeaways from each view along the way.
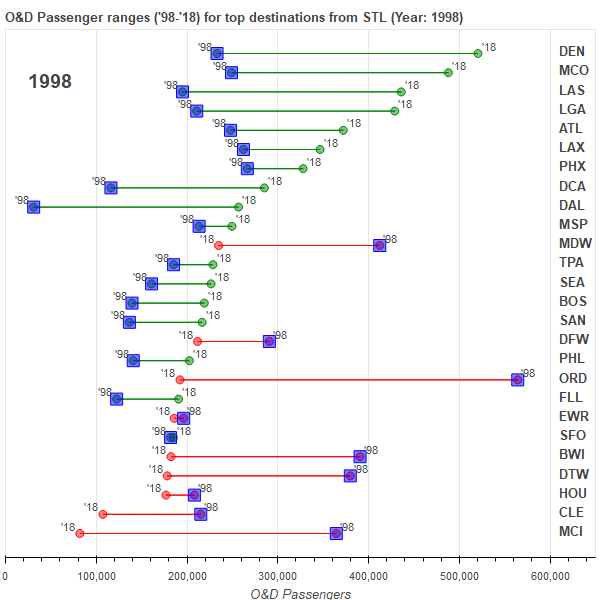
Let's first look at the biggest winners of the past 20 years (1998-2018). The biggest gainers, in terms of total increase in O&D passengers, are Denver (+287k/year), Las Vegas (+241k/year), and Orlando (+239k/year). In general, most of the biggest gainers are warm weather cities (RSW +103k, SAN +80k) and coastal destinations (BOS +79k, SEA +65k) on routes of 2 hours+. When I look at the biggest drops in the last two decades, they mostly come from closer destinations where it appears flying has fallen out of favor compared to driving (I don't suspect that the actual demand for travel between many of these locations has dropped). Chicago saw the largest drop with ORD demand falling by 372k and MDW falling by 178k. Kansas City and Detroit both saw drops of over 200k along with Baltimore which doesn't necessarily fit our "close by cities" narrative since it's over 800 miles away. I was surprised that BWI had the 3rd highest O&D of any destination from STL in 1998 and (not so surprised) that it fell to 22nd by 2018. I suspect that Regan National's (DCA) gain of 169k siphoned off some of BWI's travelers but that does not appear to tell the whole picture. I'm not sure if possibly the TWA schedules prioritized BWI over other DC/Baltimore airports (DCA, IAD). Other airports that lost at least 75k O&D travelers were Little Rock, Cleveland, Columbus, Tulsa, Dallas-Fort Worth (although Dallas-Love showed big gains), Omaha, and Oklahoma City.
Destinations from STL with largest O&D gain since 1998
| PAIR | PASSENGERS '98 | PASSENGERS '18 | INCREASE | % INCREASE |
|---|---|---|---|---|
| DEN | 233,060 | 520,490 | 287,430 | 123.3% |
| LAS | 195,060 | 435,980 | 240,920 | 123.5% |
| MCO | 248,960 | 487,930 | 238,970 | 95.9% |
| DAL | 31,030 | 256,780 | 225,750 | 727.5% |
| LGA | 210,710 | 428,890 | 218,180 | 103.5% |
| DCA | 116,170 | 285,170 | 169,000 | 145.5% |
| ATL | 247,910 | 372,150 | 124,240 | 50.1% |
| RSW | 70,420 | 173,310 | 102,890 | 146.1% |
Destinations from STL with largest O&D drop since 1998
| PAIR | PASSENGERS '98 | PASSENGERS '18 | INCREASE | % INCREASE |
|---|---|---|---|---|
| ORD | 564,350 | 192,270 | -372,080 | -65.9% |
| MCI | 364,440 | 81,910 | -282,530 | -77.5% |
| BWI | 390,620 | 182,340 | -208,280 | -53.3% |
| DTW | 379,890 | 178,120 | -201,770 | -53.1% |
| MDW | 412,320 | 234,750 | -177,570 | -43.1% |
| LIT | 141,700 | 30,270 | -111,430 | -78.6% |
| CLE | 215,170 | 107,310 | -107,860 | -50.1% |
| CMH | 158,430 | 72,750 | -85,680 | -54.1% |
For a more visual look at how the raw number of O&D passengers have changed at top destinations from STL, the chart below shows the difference between 1998 and 2018 and also shows the min and max points within those twenty years. The O&D for most top destinations has been continuing to grow in recent years with many of the maximum values being in 2018 or 2017. At the bottom of this post you can find a .gif of these values showing the change each year.
There have clearly been some significant changes in St. Louisian preferences for their air travel destinations. Instead of looking just at the raw passenger counts, the next chart shows how specific destinations have ranked for STL O&D passengers since 1993. Some interesting destinations that were highly ranked that have fallen are:
- Kansas City (I'm just amazed that even in the 90's there was that much demand just between KC and STL), which through 2001 was a top 5 final destination for St. Louis travelers
- Detroit was ranked 3rd as recently as 2003 and now is no longer in the top 20
- Cleveland dropping from 12th in 2000 to 32 in 2018
- The previously mentioned Baltimore and combined Chicago airports
O&D Passenger counts are a great measure of how much demand there is for travelers to a specific airport, but the numbers do not exist in a vacuum. The routes served and ease of access to an airport will influence the O&D travelers to/from an airport. For example, when an airport gets direct service from St. Louis it can expect a bump in it's overall O&D numbers because travelers now have easier means to access the city and when service is cut a drop can generally be expected. Here are two examples. In the 90's STL-IND had several direct flights a day, over 1M seats in annual available capacity, and the amount of O&D travelers hovered around 130k/year (see chart below). After 2001, that capacity dropped rapidly, leveling out to just over 100k seats in capacity before cratering to near zero by 2012. The O&D passengers followed a similar trend, dropping to less than 10,000 passengers by 2006. Des Moines shows a similar correlation. In 2000, capacity to Des Moines peaked at around 500k seats per year and O&D passengers that year were 36k. But Des Moines capacity dropped to basically 0 by 2012 and the O&D travelers followed suit, lowering to around 10k. However, Southwest added flights back to Des Moines in 2017 and capacity was back up to almost 200k in 2018. The O&D travelers followed bouncing back to 32k in 2018. The addition of the direct flight clearly boosted the O&D travelers. For a destination that takes 5-6 hours driving, flying did not allow for almost any time saving if a connection was required, but with a reasonably priced direct flight, lots of travelers between St. Louis and Des Moines were drawn to the route. The top two rows of charts below show how capacity and O&D travel is linked for many city pairs. But this trend doesn't always hold true, especially for farther away destinations where added connection time is not as much of a deterrent. The bottom row show three destinations where the O&D travelers grew over the 25 year period even as capacity remained the same (DEN) or even dropped (BOS and SEA).
STL's capacity and route network has changed extensively in the past 25 years. In the 90's (and early 2000's) and TWA (and subsequently American) dominated Lambert and the airport saw about twice as many total passenger as the airport saw in 2019, and that network definitely impacted the O&D from STL. Overall many destinations have seen O&D growth, but several generally nearby destinations have seen sharp declines that followed the loss of flights and seat capacity to those nearby cities. While the total O&D growth for Lambert since the 90's is not great when compared to other US airports, some of that is due to the O&D traffic in the 90's being inflated due to the massive TWA capacity and the declines in many market are more a symptom of diminished service as passengers choose alternative methods of travel rather than an actual reduction normalized demand. Hopefully the analysis here has provided a more nuanced understanding of the slow O&D growth at St. Louis. To conclude, I put together a .gif version of the green/red line chart above that shows the progression over time which I've posted below and offers a last unique look at O&D changes from STL the past two decades.
Blog on O&D at all US airports